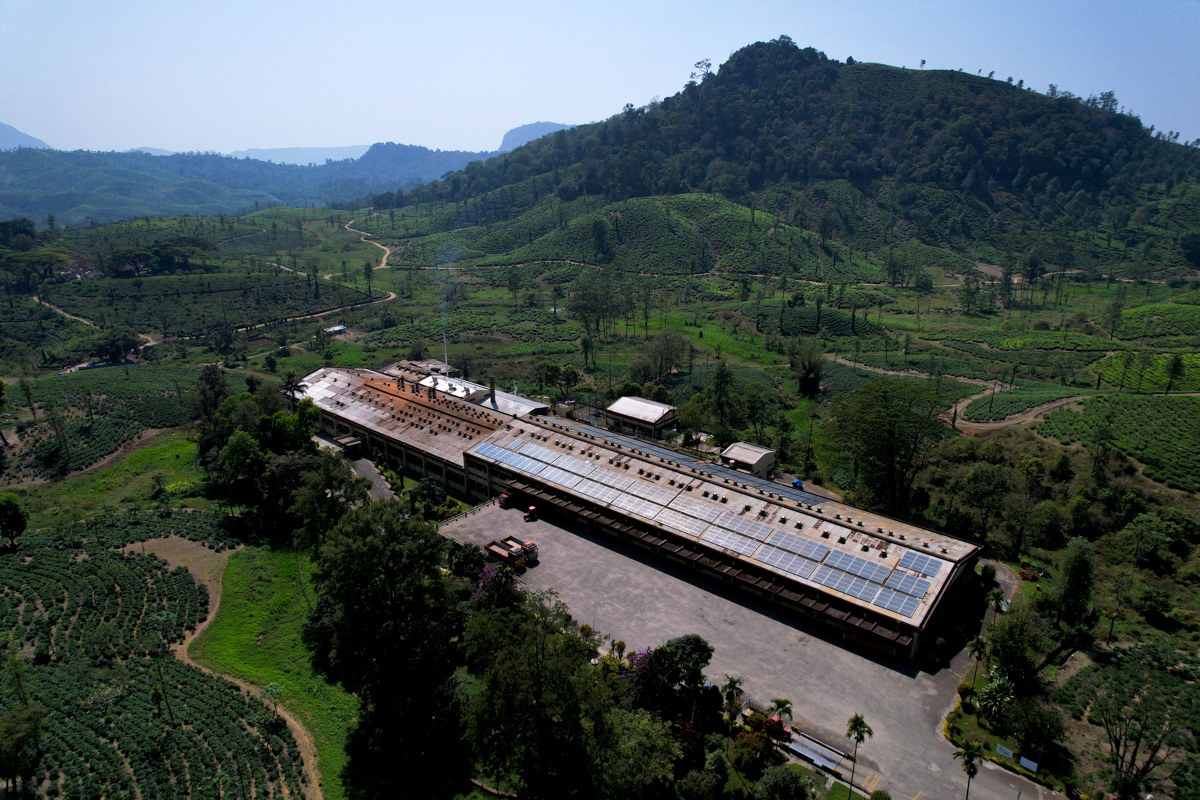
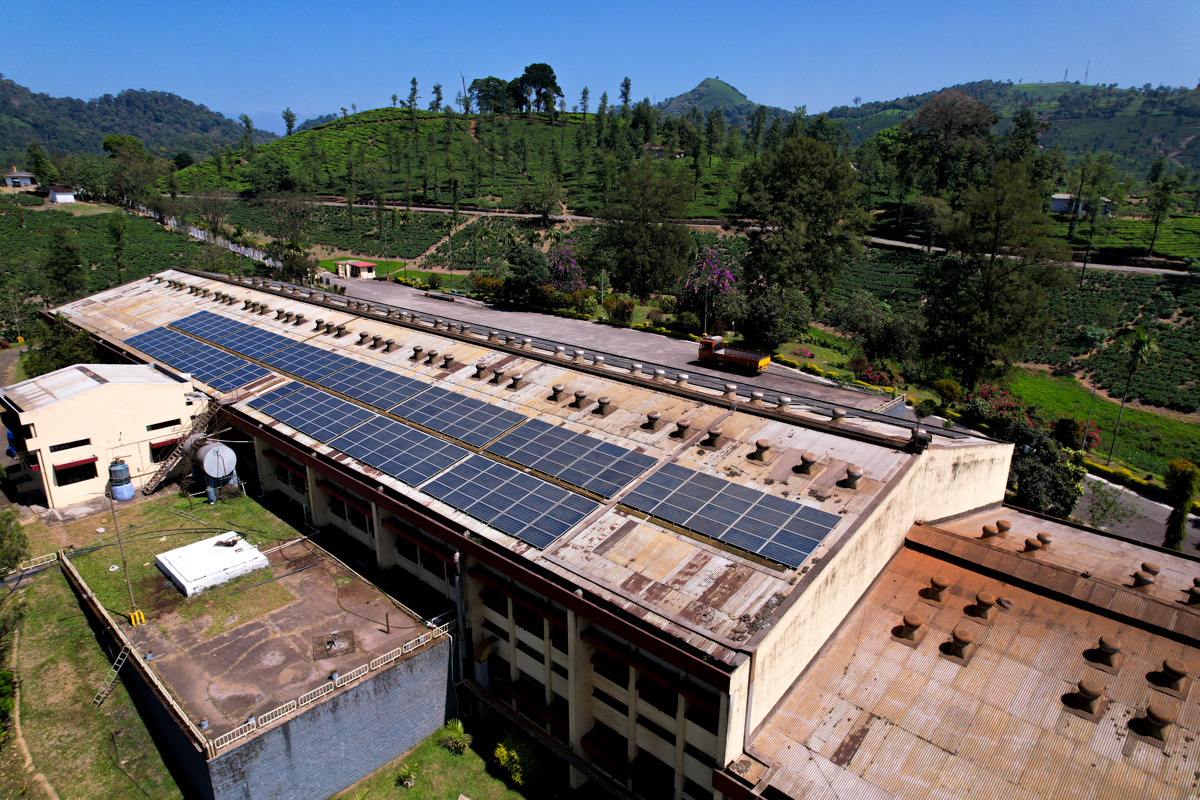
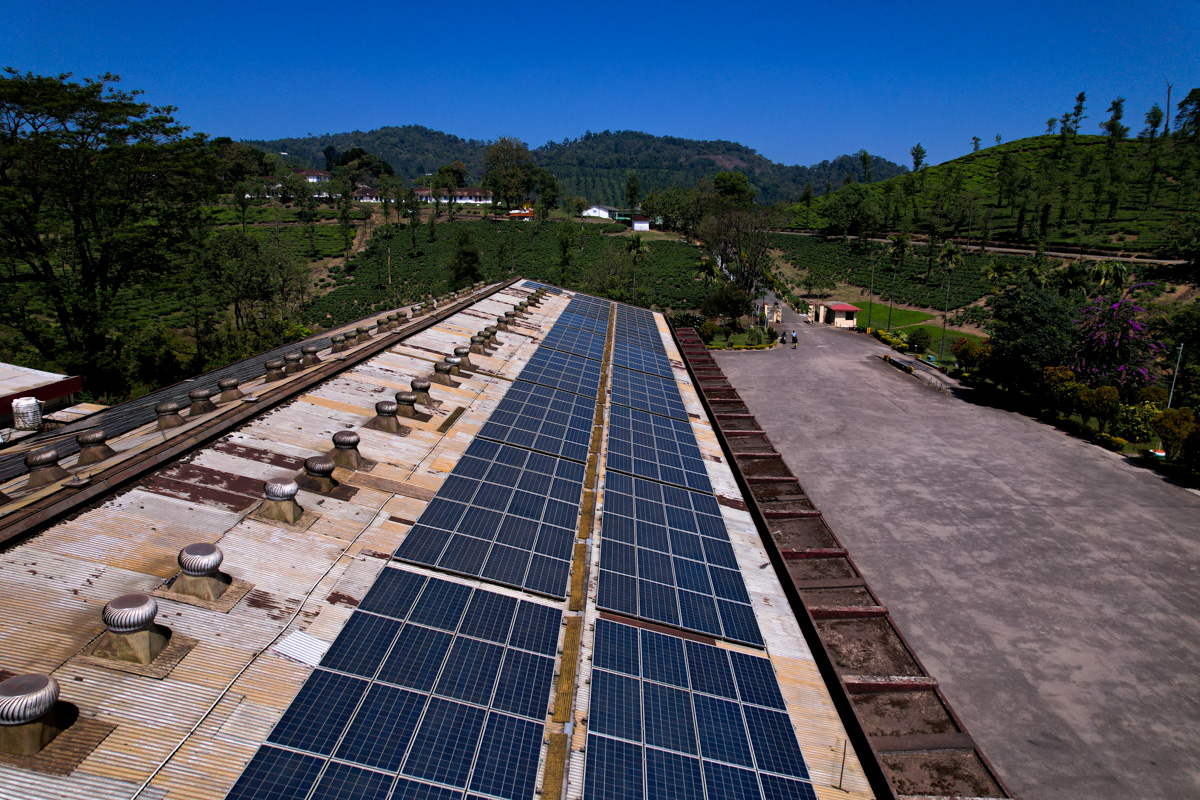
Tea Plantation Processing Site in Tamil Nadu, India
Overcast|92°F|
Pounds of CO2 offset to date
1
2
3
4
5
6
7
8
9
0
1
2
3
4
5
6
7
8
9
0
1
2
3
4
5
6
7
8
9
0
1
2
3
4
5
6
7
8
9
0
1
2
3
4
5
6
7
8
9
0
1
2
3
4
5
6
7
8
9
0
1
2
3
4
5
6
7
8
9
0
1
2
3
4
5
6
7
8
9
0
1
2
3
4
5
6
7
8
9
0
1
2
3
4
5
6
7
8
9
0
1
2
3
4
5
6
7
8
9
0
1
2
3
4
5
6
7
8
9
0
1
2
3
4
5
6
7
8
9
0
1
2
3
4
5
6
7
8
9
0
1
2
3
4
5
6
7
8
9
0
1
2
3
4
5
6
7
8
9
0
1
2
3
4
5
6
7
8
9
0
1
2
3
4
5
6
7
8
9
0
1
2
3
4
5
6
7
8
9
0
1
2
3
4
5
6
7
8
9
0
1
2
3
4
5
6
7
8
9
0
1
2
3
4
5
6
7
8
9
0
1
2
3
4
5
6
7
8
9
0
1
2
3
4
5
6
7
8
9
0
1
2
3
4
5
6
7
8
9
0
1
2
3
4
5
6
7
8
9
0
1
2
3
4
5
6
7
8
9
0
1
2
3
4
5
6
7
8
9
0
1
2
3
4
5
6
7
8
9
0
1
2
3
4
5
6
7
8
9
0
1
2
3
4
5
6
7
8
9
0
1
2
3
4
5
6
7
8
9
0
1
2
3
4
5
6
7
8
9
0
1
2
3
4
5
6
7
8
9
0
1
2
3
4
5
6
7
8
9
0
1
2
3
4
5
6
7
8
9
0
1
2
3
4
5
6
7
8
9
0
1
2
3
4
5
6
7
8
9
0
1
2
3
4
5
6
7
8
9
0
1
2
3
4
5
6
7
8
9
0
1
2
3
4
5
6
7
8
9
0
1
2
3
4
5
6
7
8
9
0
1
2
3
4
5
6
7
8
9
0
1
2
3
4
5
6
7
8
9
0
1
2
3
4
5
6
7
8
9
0
1
2
3
4
5
6
7
8
9
0
1
2
3
4
5
6
7
8
9
0
1
2
3
4
5
6
7
8
9
0
1
2
3
4
5
6
7
8
9
0
1
2
3
4
5
6
7
8
9
0
1
2
3
4
5
6
7
8
9
0
1
2
3
4
5
6
7
8
9
0
1
2
3
4
5
6
7
8
9
0
1
2
3
4
5
6
7
8
9
0
1
2
3
4
5
6
7
8
9
0
1
2
3
4
5
6
7
8
9
0
1
2
3
4
5
6
7
8
9
0
1
2
3
4
5
6
7
8
9
0
1
2
3
4
5
6
7
8
9
0
1
2
3
4
5
6
7
8
9
0
,
1
2
3
4
5
6
7
8
9
0
1
2
3
4
5
6
7
8
9
0
1
2
3
4
5
6
7
8
9
0
1
2
3
4
5
6
7
8
9
0
1
2
3
4
5
6
7
8
9
0
1
2
3
4
5
6
7
8
9
0
1
2
3
4
5
6
7
8
9
0
1
2
3
4
5
6
7
8
9
0
1
2
3
4
5
6
7
8
9
0
1
2
3
4
5
6
7
8
9
0
1
2
3
4
5
6
7
8
9
0
1
2
3
4
5
6
7
8
9
0
1
2
3
4
5
6
7
8
9
0
1
2
3
4
5
6
7
8
9
0
1
2
3
4
5
6
7
8
9
0
1
2
3
4
5
6
7
8
9
0
1
2
3
4
5
6
7
8
9
0
1
2
3
4
5
6
7
8
9
0
1
2
3
4
5
6
7
8
9
0
1
2
3
4
5
6
7
8
9
0
1
2
3
4
5
6
7
8
9
0
1
2
3
4
5
6
7
8
9
0
1
2
3
4
5
6
7
8
9
0
1
2
3
4
5
6
7
8
9
0
1
2
3
4
5
6
7
8
9
0
1
2
3
4
5
6
7
8
9
0
1
2
3
4
5
6
7
8
9
0
1
2
3
4
5
6
7
8
9
0
1
2
3
4
5
6
7
8
9
0
1
2
3
4
5
6
7
8
9
0
1
2
3
4
5
6
7
8
9
0
1
2
3
4
5
6
7
8
9
0
1
2
3
4
5
6
7
8
9
0
1
2
3
4
5
6
7
8
9
0
1
2
3
4
5
6
7
8
9
0
1
2
3
4
5
6
7
8
9
0
1
2
3
4
5
6
7
8
9
0
1
2
3
4
5
6
7
8
9
0
1
2
3
4
5
6
7
8
9
0
1
2
3
4
5
6
7
8
9
0
1
2
3
4
5
6
7
8
9
0
1
2
3
4
5
6
7
8
9
0
1
2
3
4
5
6
7
8
9
0
1
2
3
4
5
6
7
8
9
0
1
2
3
4
5
6
7
8
9
0
1
2
3
4
5
6
7
8
9
0
1
2
3
4
5
6
7
8
9
0
1
2
3
4
5
6
7
8
9
0
1
2
3
4
5
6
7
8
9
0
1
2
3
4
5
6
7
8
9
0
1
2
3
4
5
6
7
8
9
0
1
2
3
4
5
6
7
8
9
0
1
2
3
4
5
6
7
8
9
0
1
2
3
4
5
6
7
8
9
0
1
2
3
4
5
6
7
8
9
0
1
2
3
4
5
6
7
8
9
0
1
2
3
4
5
6
7
8
9
0
1
2
3
4
5
6
7
8
9
0
1
2
3
4
5
6
7
8
9
0
1
2
3
4
5
6
7
8
9
0
.
1
2
3
4
5
6
7
8
9
0
1
2
3
4
5
6
7
8
9
0
1
2
3
4
5
6
7
8
9
0
1
2
3
4
5
6
7
8
9
0
1
2
3
4
5
6
7
8
9
0
1
2
3
4
5
6
7
8
9
0
1
2
3
4
5
6
7
8
9
0
1
2
3
4
5
6
7
8
9
0
1
2
3
4
5
6
7
8
9
0
1
2
3
4
5
6
7
8
9
0
1
2
3
4
5
6
7
8
9
0
1
2
3
4
5
6
7
8
9
0
1
2
3
4
5
6
7
8
9
0
1
2
3
4
5
6
7
8
9
0
1
2
3
4
5
6
7
8
9
0
1
2
3
4
5
6
7
8
9
0
1
2
3
4
5
6
7
8
9
0
1
2
3
4
5
6
7
8
9
0
1
2
3
4
5
6
7
8
9
0
1
2
3
4
5
6
7
8
9
0
1
2
3
4
5
6
7
8
9
0
1
2
3
4
5
6
7
8
9
0
1
2
3
4
5
6
7
8
9
0
1
2
3
4
5
6
7
8
9
0
1
2
3
4
5
6
7
8
9
0
1
2
3
4
5
6
7
8
9
0
1
2
3
4
5
6
7
8
9
0
1
2
3
4
5
6
7
8
9
0
1
2
3
4
5
6
7
8
9
0
1
2
3
4
5
6
7
8
9
0
1
2
3
4
5
6
7
8
9
0
1
2
3
4
5
6
7
8
9
0
1
2
3
4
5
6
7
8
9
0
1
2
3
4
5
6
7
8
9
0
1
2
3
4
5
6
7
8
9
0
1
2
3
4
5
6
7
8
9
0
1
2
3
4
5
6
7
8
9
0
1
2
3
4
5
6
7
8
9
0
1
2
3
4
5
6
7
8
9
0
1
2
3
4
5
6
7
8
9
0
System size
205 kW
Location
India
How solar in Tamil Nadu creates 2.3x the impact
Start investing13 more watts per $100 invested
For every $100 invested in this project, we install 1.2x more solar capacity than a similar solar project in the United States.
Learn more→60 watts built with $100
United States
73 watts built with $100
Tamil Nadu
153 more sunny hours per year
This solar project receives 1.1x the sunshine hours each year compared with typical US solar projects.
Learn more→1,745 sunny hours per year
United States
1,898 sunny hours per year
Tamil Nadu
265 grams more carbon avoided per kWh generated
Power grids across Tamil Nadu generate 265 more grams of carbon pollution per kilowatt hour than US grids. This project creates 1.7x the carbon impact per dollar invested compared with similar US projects.
Learn more→367 gCO₂/kWh
United States
632 gCO₂/kWh
Tamil Nadu
Ready to get started?
Make a nonprofit investment
Most Popular
$350
Nonprofit investment

CARBON AVOIDED
74% of an average US home's annual electricity carbon
7-hour flight
29% of average American monthly carbon impact
Other amount
Create your own nonprofit solar investment in the Global South
$50
Nonprofit investment

CARBON AVOIDED
11% of an average US home's annual electricity carbon
2-hour flight
5% of average American monthly carbon impact
Most Popular
$350
Nonprofit investment
CARBON AVOIDED
74% of an average US home's annual electricity carbon
7-hour flight
29% of average American monthly carbon impact
$25
Monthly auto-investment

CARBON AVOIDED
5% of an average US home's annual electricity carbon
1-hour flight
3% of average American monthly carbon impact
Other amount
Create your own nonprofit solar investment in the Global South